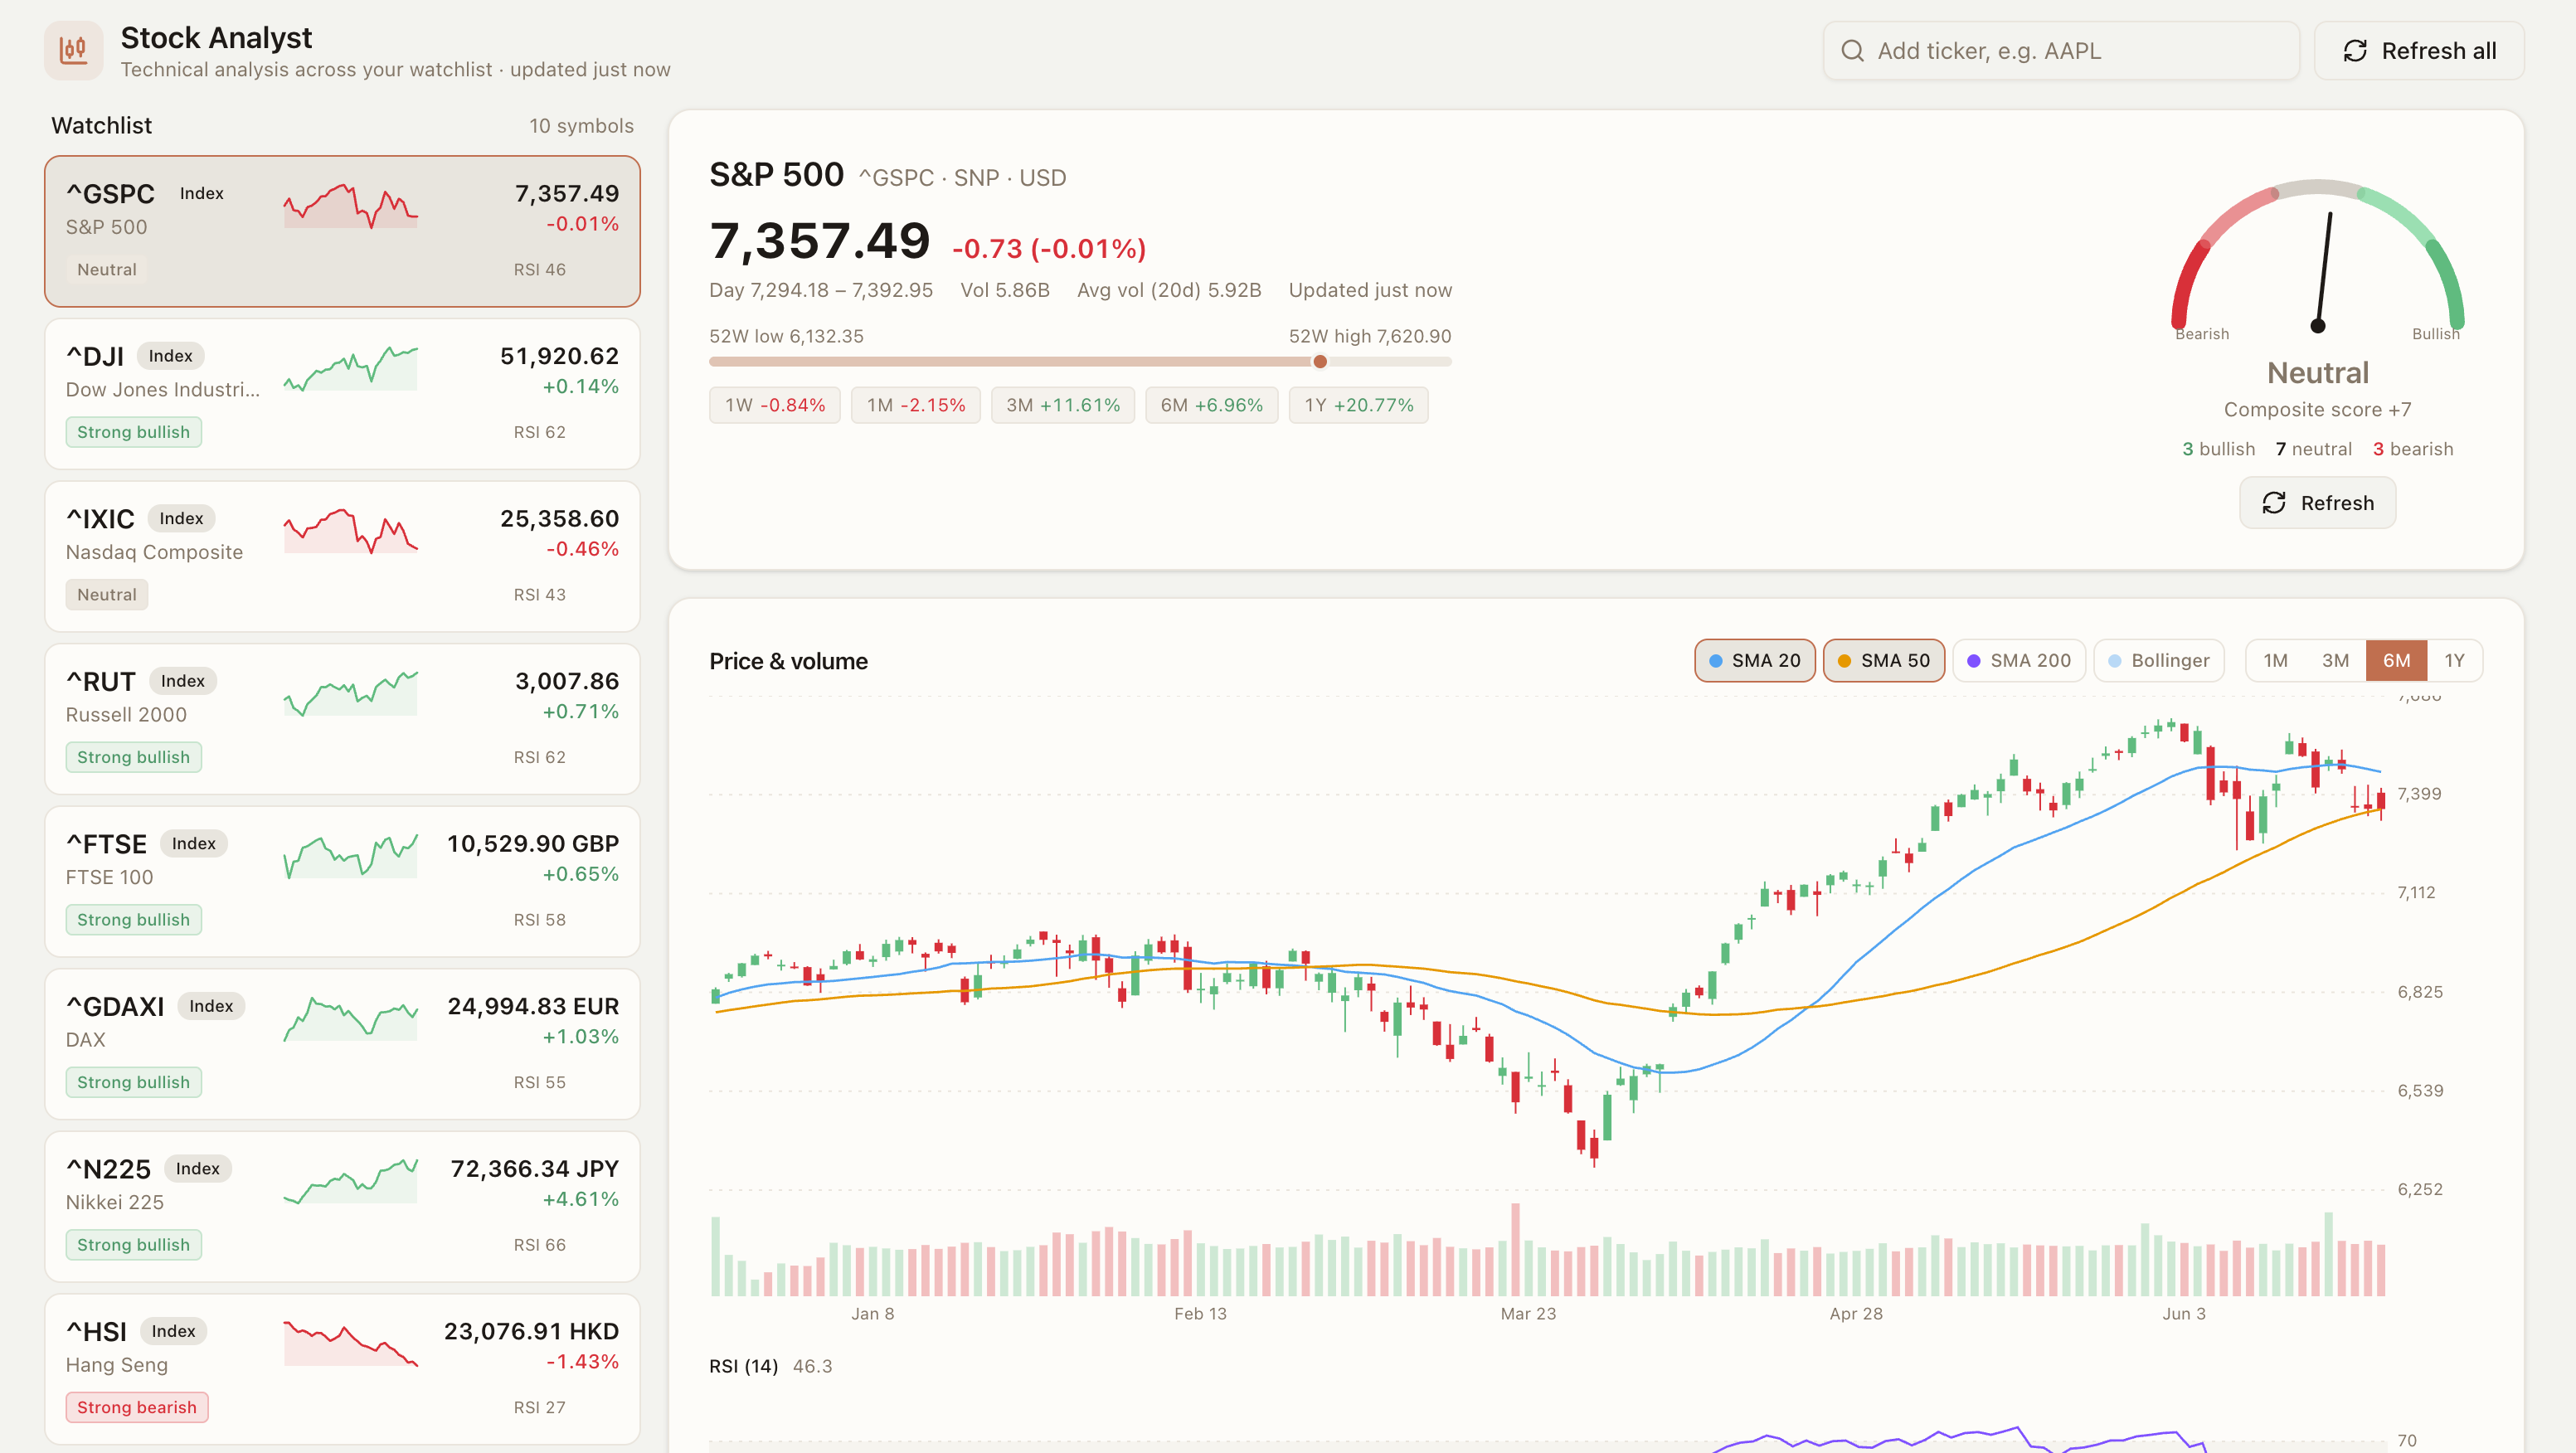
Stock Analyst is a technical-analysis dashboard for the markets you care about. Add any stock, ETF, or index to your watchlist and get a structured, plain-language read on its trend, momentum, and key levels — all on one screen.
What it does
- Watchlist at a glance — live price, daily change, a 30-day sparkline, RSI, and an overall bullish/bearish verdict for every symbol. The major world indexes (S&P 500, Dow, Nasdaq, Russell 2000, FTSE 100, DAX, Nikkei 225, Hang Seng) are included out of the box.
- Full technical workup per symbol — an interactive candlestick chart with volume, moving-average and Bollinger Band overlays, plus dedicated RSI and MACD panels.
- Structured signal summary — a composite bullish/bearish gauge built from a dozen classic indicators (moving averages, MACD, ADX, RSI, stochastic, CCI, Williams %R, Bollinger %B, OBV, momentum), each explained in plain language.
- Key levels — swing-based support and resistance plus classic daily pivot points.
- Performance snapshot — 1-week through 1-year returns and the 52-week range at a glance.
When to reach for it
- A morning scan of the major indexes before the open.
- A quick technical read on a stock before you buy, sell, or set an alert.
- Tracking a personal watchlist without spreadsheets or paid charting tools.
Search any ticker to add it; analysis refreshes on demand. For technical context only — not investment advice.